Novatib. Dashboards
Clinician-led · Governance-first · NHS-aware

Management dashboards that run entirely in your browser.

Occupancy, staffing, money, safety and governance for health and care providers — in a single file that opens like a web page. Your data never leaves your device. No signup, no server, no installation.

Built by Novatib — a clinician-led healthcare consultancy · London · +44 20 8569 9918
1

Open the dashboard

It's one HTML file. Open it in any modern browser — laptop, tablet or phone. The demos below load with realistic synthetic data.

2

Drop your own export

Drag a CSV or Excel export from your existing systems onto the page. Files are recognised automatically by their column headings.

3

See your service clearly

Trends, comparisons, exceptions and board-ready reports — recalculated live on your machine, and only your machine.

Live demonstrations

Every demo below runs on synthetic data and is the real product — rearrange it, interrogate it, print a board pack, or drop a file of your own onto it.

Care homes
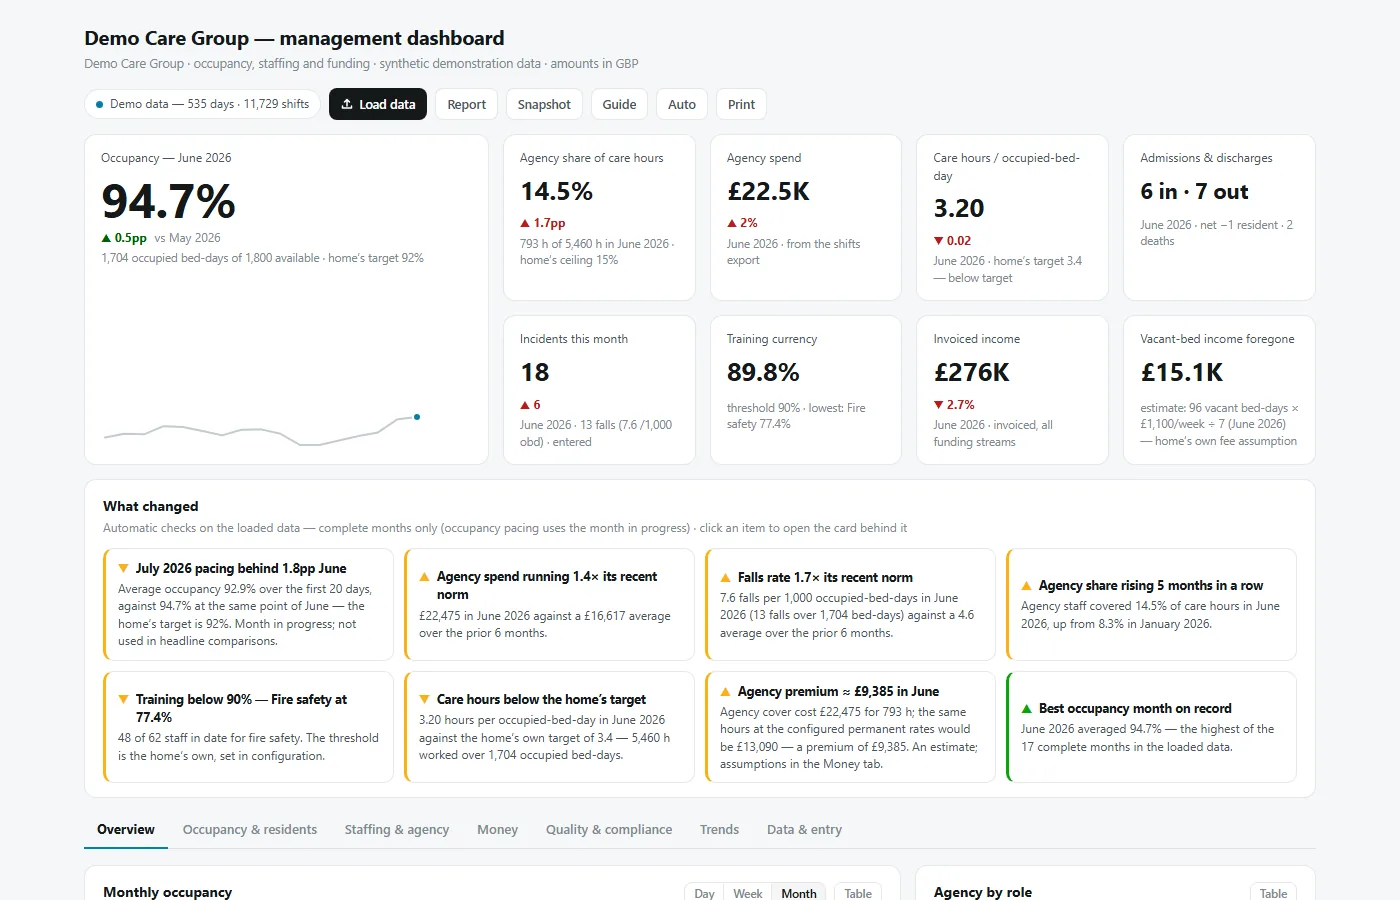
Care home dashboard overview: occupancy 94.7%, agency share of care hours, agency spend, care hours per occupied bed-day, and an automatic list of what changed this month.

Care home management

  • Occupancy, voids, admissions & discharges
  • Staffing vs plan, agency share & premium
  • Funding mix and income
  • Falls per 1,000 occupied bed days
  • Inspection-evidence readiness meter
Open live demo
Aggregate and name-free by design.
Hospital pharmacy
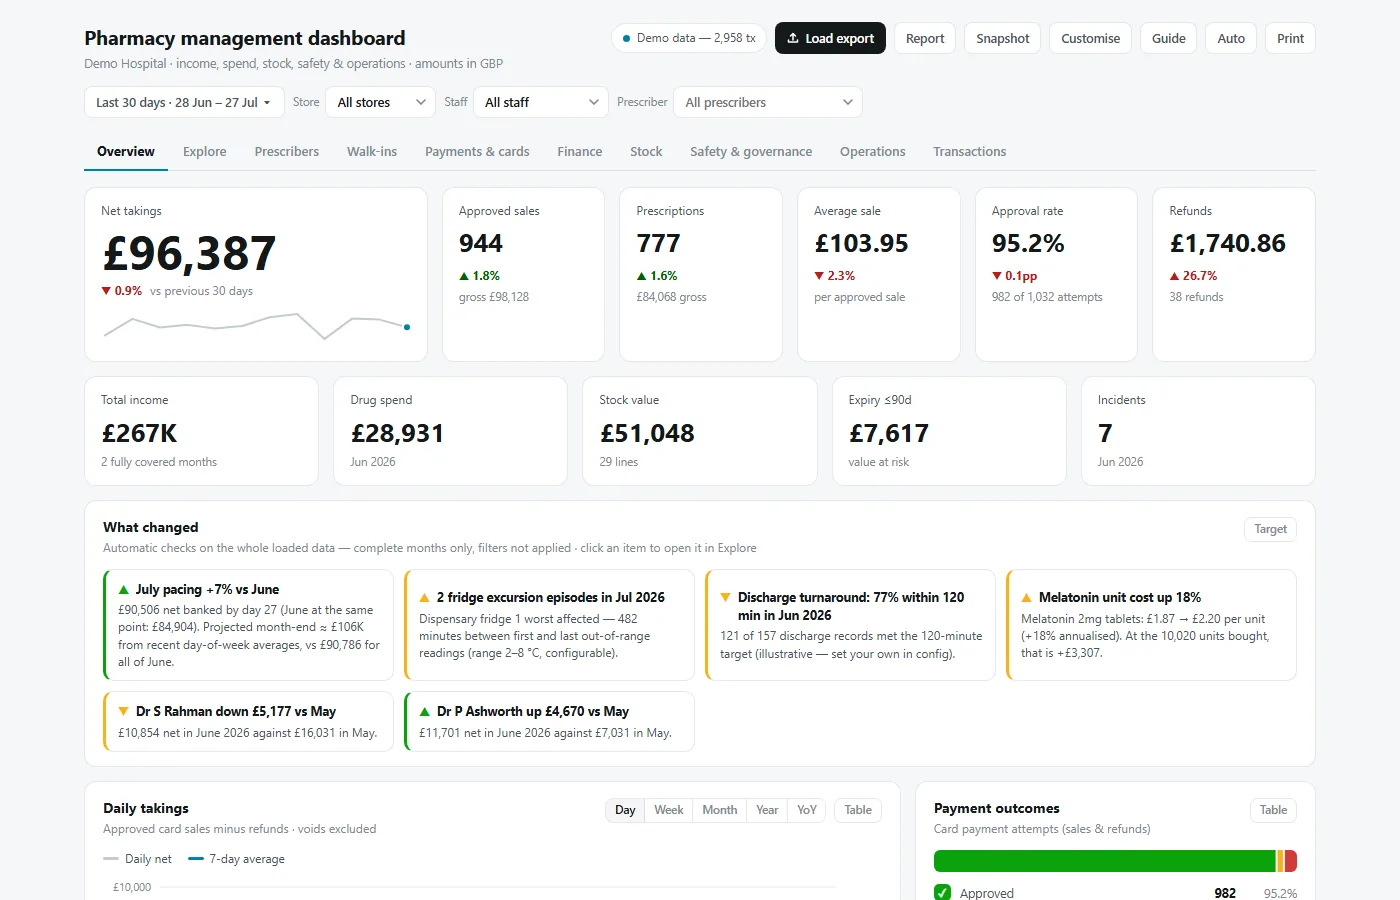
Hospital pharmacy dashboard overview: net takings, approved sales, prescriptions, average sale, approval rate and refunds, above an automatic list of what changed.

Pharmacy management

  • Income by stream, payer mix & aged debt
  • Purchasing, price inflation & stock expiry
  • Medicines-safety incidents & interventions
  • Controlled-drug governance, cold chain
  • Dispensing workload & turnaround
Request a private preview
In deployment with a London hospital.
Neonatal units
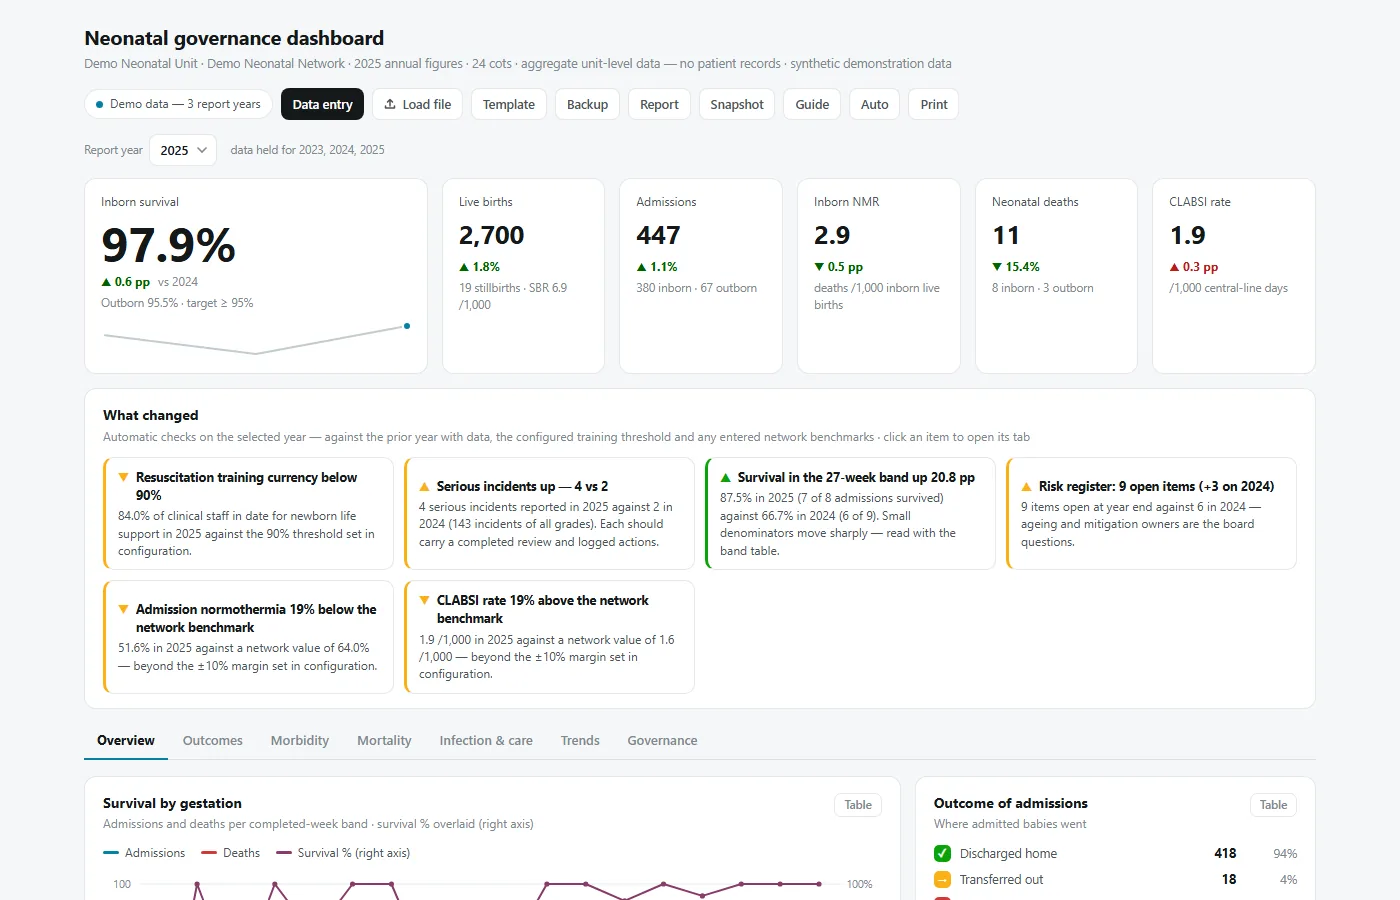
Neonatal governance dashboard overview: inborn survival 97.9%, live births, admissions, inborn neonatal mortality rate, neonatal deaths and CLABSI rate.

Neonatal governance

  • Survival by gestation and birthweight
  • Morbidity, infection & care bundles
  • Eleven-domain governance completeness
  • Year-on-year unit trends
  • Aggregate unit-level data only
Open live demo
Management information — not a clinical decision tool.
What it looks like

Three tabs from the live demos above, on synthetic data. Every chart is drawn in your browser from the file you drop on it — there is no server behind these.

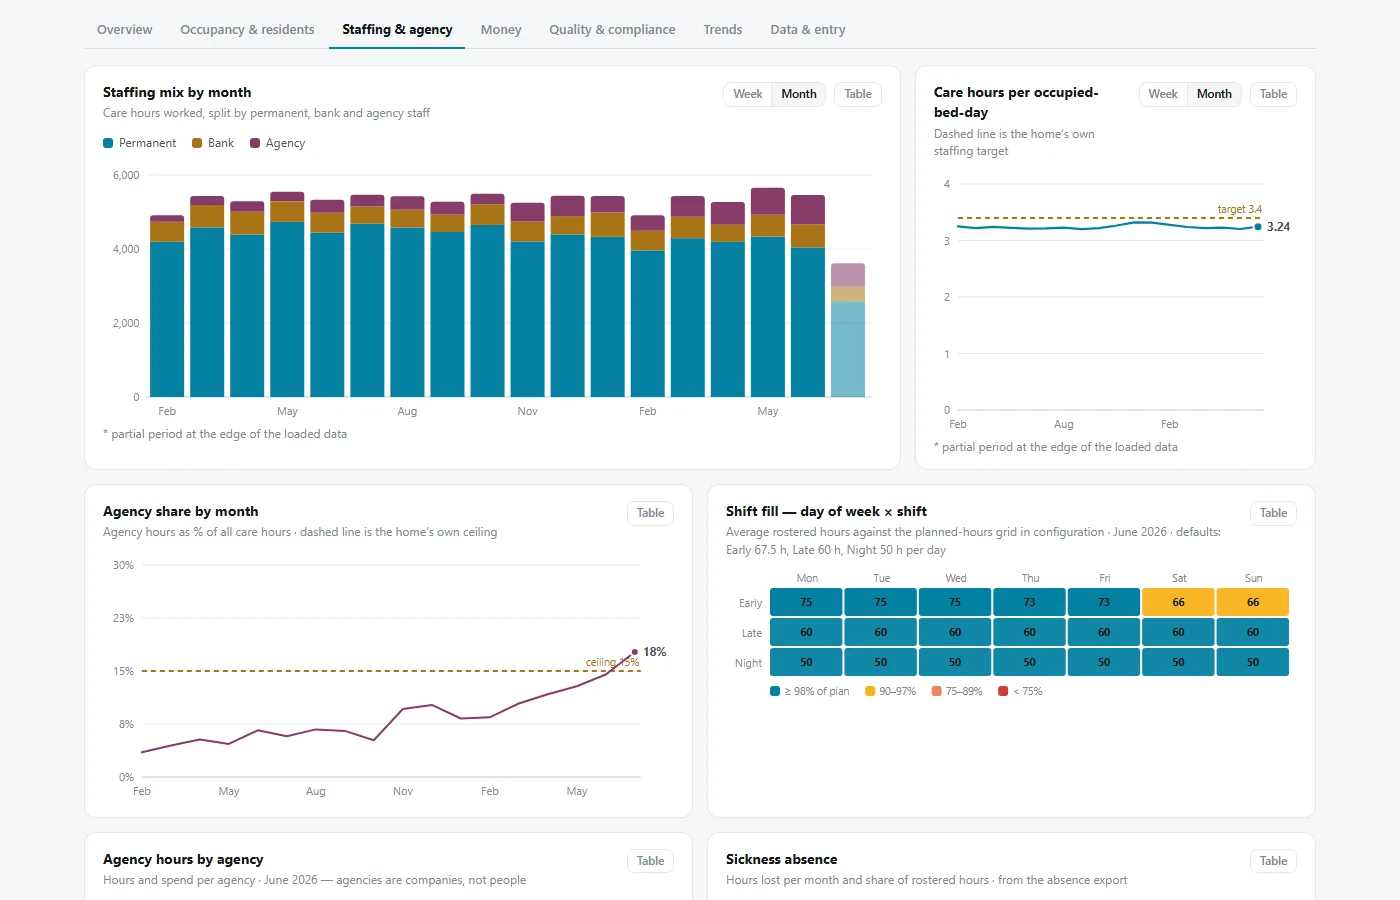
Staffing and agency tab of the care home dashboard: staffing mix by month split by permanent, bank and agency; care hours per occupied bed-day against target; agency share by month against the home's ceiling; and a shift-fill grid by day of week.
Care homes — staffing & agency. Permanent, bank and agency hours by month, agency share against the home's own ceiling, and shift fill against the planned-hours grid.
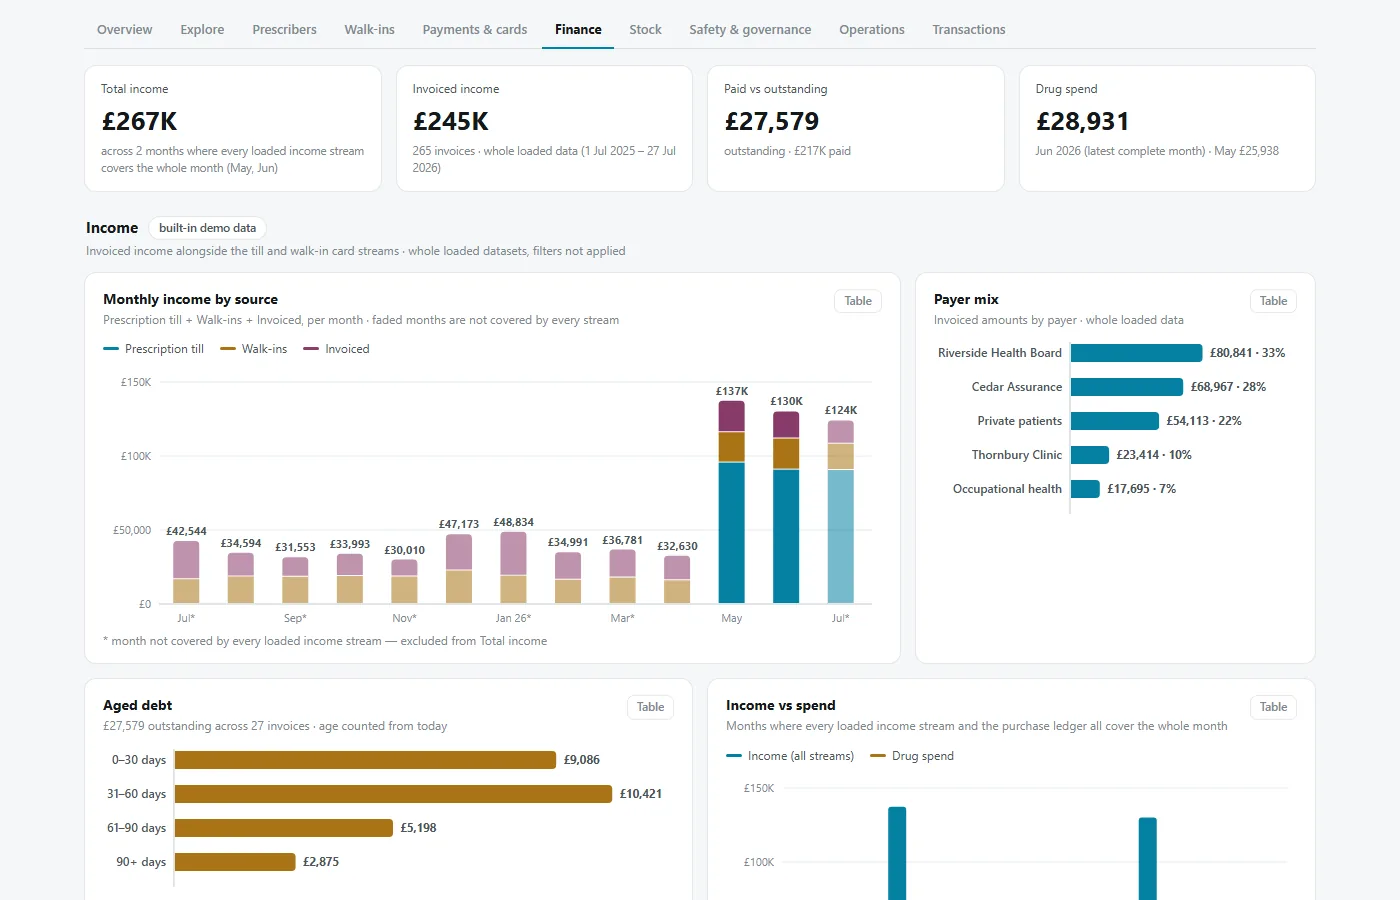
Finance tab of the hospital pharmacy dashboard: total income, invoiced income, paid versus outstanding and drug spend, with monthly income by source, payer mix, aged debt and income versus spend.
Hospital pharmacy — finance. Monthly income by source, payer mix, aged debt and income against drug spend, across every loaded stream.
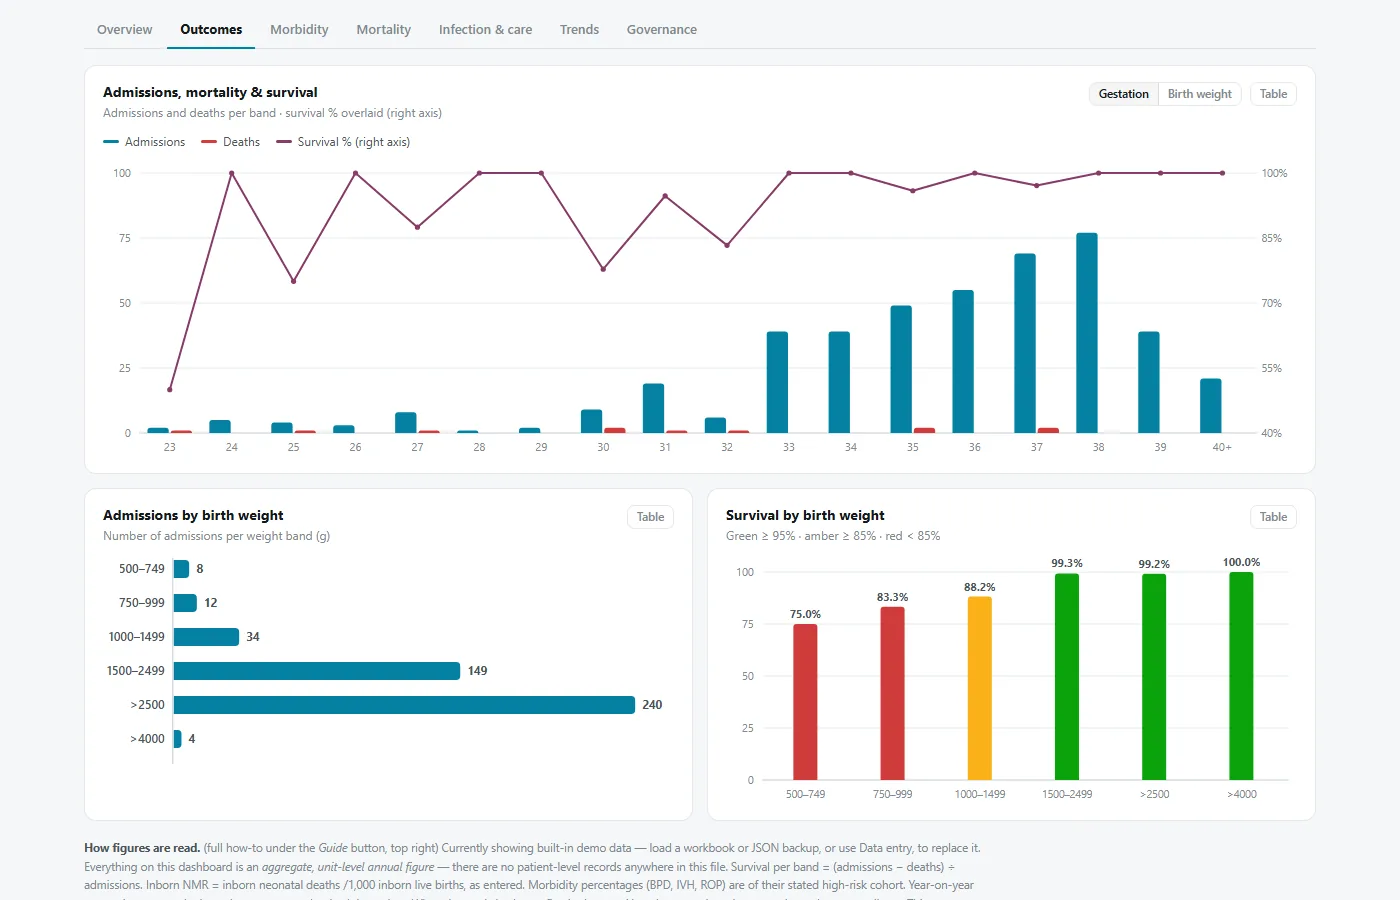
Outcomes tab of the neonatal governance dashboard: admissions, mortality and survival by completed-week gestation band, admissions by birth weight, and survival by birth weight band colour-coded against thresholds.
Neonatal units — outcomes. Admissions, deaths and survival by gestation band, and survival by birth weight against your thresholds — aggregate figures only.

Why local-first matters in health and care

Most analytics products ask you to upload your data to their cloud — which means information-governance reviews, data-processing agreements, and another system holding information about the people in your care.

These dashboards take the opposite approach. There is no server. The dashboard is a single file; your exports are processed by your own browser, on your own device, and the moment you close the tab, nothing persists anywhere. Patient-identifying columns in operational exports are dropped on load, and the clinical dashboards work from aggregate, name-free numbers by design.

It also means the dashboards work offline, cost nothing to host, and can be shared inside your organisation like any other file — with frozen snapshots for boards and inspectors.

0servers, accounts or uploads — processing stays on your device
1file per dashboard — open it anywhere, including offline
2ways in: use the built-in demo data, or drop your own CSV / Excel export
board packs, frozen snapshots and CSV extracts built in
your layout, your targets, your branding — set per site, not per rebuild

Built by clinicians who run services

Novatib is a clinician-led consultancy working on healthcare operational intelligence and transformation — governance and compliance, workforce operations, and AI readiness for NHS-aware organisations.

The dashboards grew out of that work: managers kept asking for a clear view of their service without a data warehouse project, a BI licence, or an information-governance headache. So we built reporting that respects how health and care actually handles data.

Each dashboard ships with illustrative defaults and is tailored to your service — your data layouts, your targets, your terminology — as a fixed-fee engagement with ongoing support.

Talk to us

Book a discovery call and bring a spreadsheet — the first thing we'll do is drop it onto a dashboard, live.

Book via novatib.com

or call +44 20 8569 9918